
-
About Us
-
Core Businesses
Core Businesses
-
Statistics & Archive
Statistics & Archive
-
Contact us
Contact Us
모바일전체메뉴 닫기
-
About Us
-
Core Businesses
-
Statistics & Archive
-
Contact Us
- Total
- Metal Can
(Total) - Metal Can(Steel)
- Metal Can(Aluminum)
- Carton Pack
- Glass Bottle
- PET
- Expanded Plastic
(EPS, PSP, etc) - Plastic Containers
& Films(Total) - Plastic Containers
- Plastic Films
& Sheets
Rocorded on 31. Dec. 2019. / ton
| Category/Year | 2003 | 2004 | 2005 | 2006 | 2007 | 2008 | 2009 | 2010 | 2011 | 2012 | 2013 | 2014 | 2015 | 2016 | 2017 | 2018 | 2019 |
|---|---|---|---|---|---|---|---|---|---|---|---|---|---|---|---|---|---|
| Delivered/Imported Qty. | 999,823 | 1,179,895 | 1,188,243 | 1,172,052 | 1,196,535 | 1,173,208 | 1,143,090 | 1,228,028 | 1,267,342 | 1,269,108 | 1,275,654 | 1,405,572 | 1,487,002 | 1,546,509 | 1,593,011 | 1,640,191 | 1,645,912 |
| Mandaroty Recycling Qty. | 642,478 | 672,412 | 709,970 | 711,924 | 754,942 | 764,527 | 758,758 | 841,010 | 895,435 | 928,697 | 925,633 | 1,020,368 | 1,095,962 | 1,155,915 | 1,180,168 | 1,204,010 | 1,211,546 |
| Recycling Result | 642,845 | 700,787 | 798,102 | 796,514 | 867,448 | 865,184 | 856,497 | 917,092 | 988,629 | 944,407 | 957,846 | 1,114,213 | 1,225,066 | 1,265,629 | 1,281,368 | 1,289,429 | 1,290,416 |
| Recycling Rate | 64% | 59% | 67% | 68% | 72% | 74% | 75% | 75% | 78% | 74% | 75% | 79% | 82% | 82% | 80% | 79% | 78% |
- Delivered / Imported Qty.
- Mandaroty Recycling Qty.
- Recycling Result
- Recycling Rate
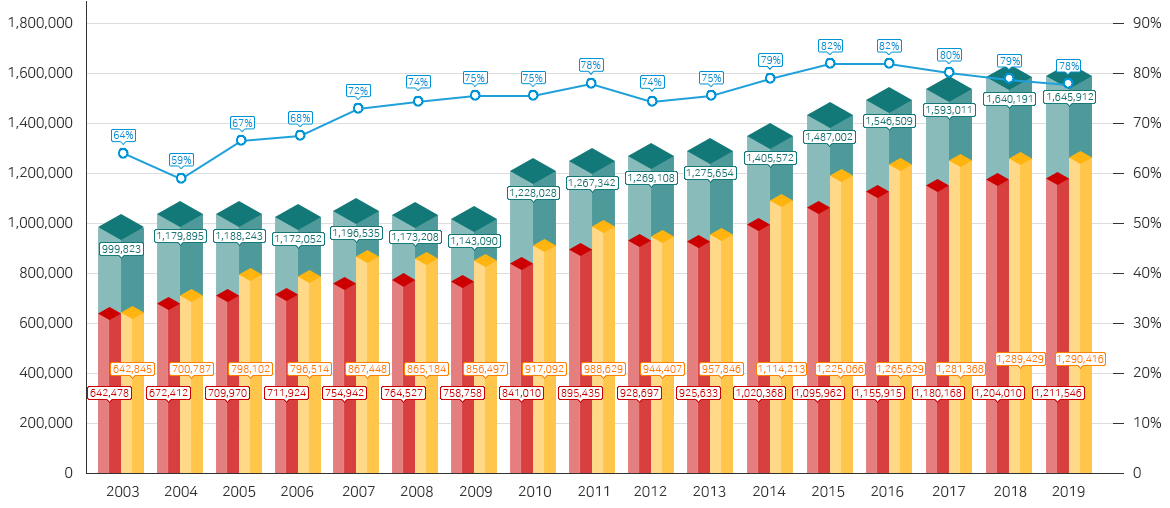
※ Including data of KORA and producers who are not member of KPRC
※ The data before established KORA(‘03~’13) is based on Ministry of Environment and KECO

03736 4~5 Floor, 53, Chungjeong-ro, Seodaemun-gu, Seoul, Republic of Korea
TEL : 02-768-1600 | FAX : 02-768-1699
Copyright ⓒ KORA.OR.KR All right reserved